To monitor Logstash nodes:
Identify where to send monitoring data. This cluster is often referred to asthe production cluster. For examples of typical monitoring architectures, seeHow Monitoring Works.

To visualize Logstash as part of the Elastic Stack (as shown in Step6), send metrics to your production cluster. Sending metrics to a dedicatedmonitoring cluster will show the Logstash metrics under the monitoring cluster.
- Verify that the
xpack.monitoring.collection.enabledsetting istrueon theproduction cluster. If that setting isfalse, the collection of monitoring datais disabled in Elasticsearch and data is ignored from all other sources. Configure your Logstash nodes to send metrics by setting the
xpack.monitoring.elasticsearch.hostsinlogstash.yml. If X-Pack security is enabled,you also need to specify the credentials for thebuilt-inlogstash_systemuser. For more information about these settings, see Monitoring Settings.xpack.monitoring.elasticsearch.hosts: ["http://es-prod-node-1:9200", "http://es-prod-node-2:9200"]
 xpack.monitoring.elasticsearch.username: "logstash_system"
  xpack.monitoring.elasticsearch.password: "changeme"
 If SSL/TLS is enabled on the production cluster, you mustconnect through HTTPS. As of v5.2.1, you can specify multipleElasticsearch hosts as an array as well as specifying a singlehost as a string. If multiple URLs are specified, Logstashcan round-robin requests to these production nodes.
If X-Pack security is disabled on the production cluster, you can omit these
usernameandpasswordsettings.If SSL/TLS is enabled on the production Elasticsearch cluster, specify the trustedCA certificates that will be used to verify the identity of the nodesin the cluster.
To add a CA certificate to a Logstash node’s trusted certificates, youcan specify the location of the PEM encoded certificate with the
certificate_authoritysetting:xpack.monitoring.elasticsearch.ssl.certificate_authority: /path/to/ca.crt
Alternatively, you can configure trusted certificates using a truststore(a Java Keystore file that contains the certificates):
xpack.monitoring.elasticsearch.ssl.truststore.path: /path/to/filexpack.monitoring.elasticsearch.ssl.truststore.password: password
Also, optionally, you can set up client certificate using a keystore(a Java Keystore file that contains the certificate):
xpack.monitoring.elasticsearch.ssl.keystore.path: /path/to/filexpack.monitoring.elasticsearch.ssl.keystore.password: password
Set sniffing to
trueto enable discovery of other nodes of the Elasticsearch cluster.It defaults tofalse.xpack.monitoring.elasticsearch.sniffing: false
- Restart your Logstash nodes.
To verify your X-Pack monitoring configuration, point your web browser at your Kibanahost, and select Monitoring from the side navigation. Metrics reported fromyour Logstash nodes should be visible in the Logstash section. When security isenabled, to view the monitoring dashboards you must log in to Kibana as a userwho has the
kibana_userandmonitoring_userroles.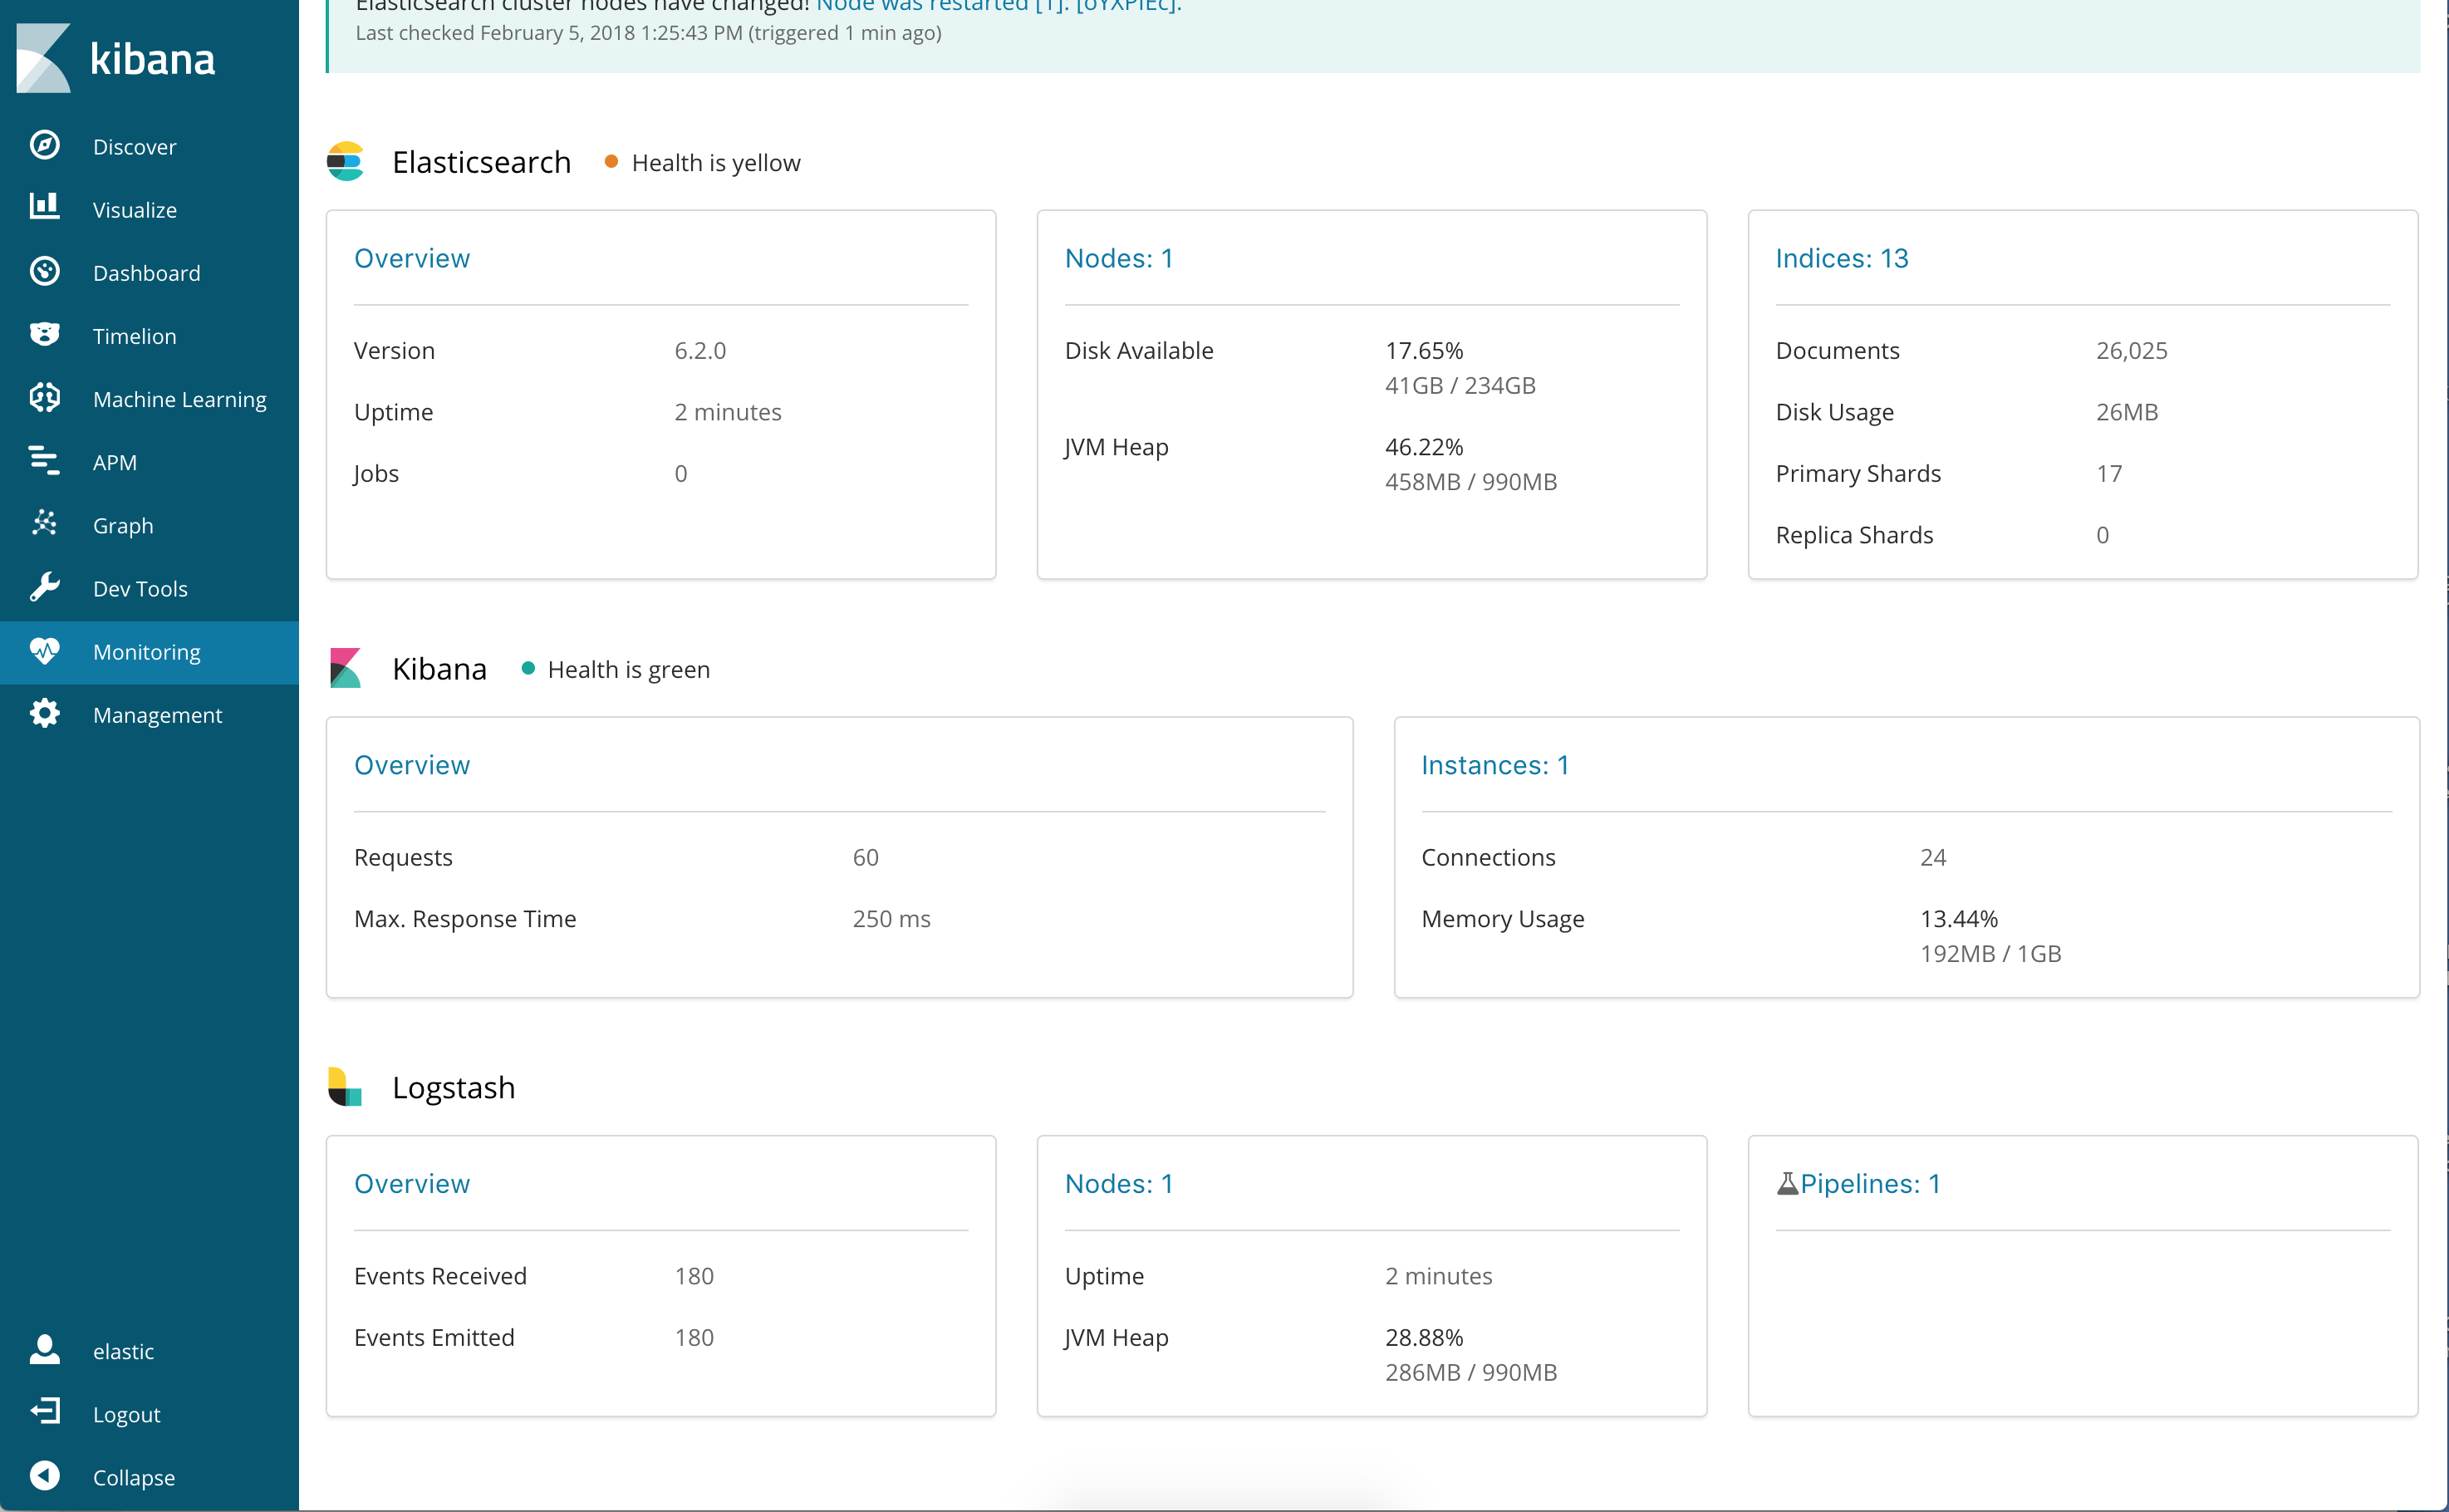
Re-enabling Logstash Monitoring After Upgrading
When upgrading from older versions of X-Pack, the built-in logstash_systemuser is disabled for security reasons. To resume monitoring,change the password and re-enable the logstash_system user.
You can set the following xpack.monitoring settings in logstash.yml tocontrol how monitoring data is collected from your Logstash nodes. However, thedefaults work best in most circumstances. For more information about configuringLogstash, see logstash.yml.
General Monitoring Settings
-
xpack.monitoring.enabled -
Monitoring is disabled by default. Set to
trueto enable X-Pack monitoring. -
xpack.monitoring.elasticsearch.hosts -
The Elasticsearch instances that you want to ship your Logstash metrics to. This might bethe same Elasticsearch instance specified in the
outputssection in your Logstashconfiguration, or a different one. This is not the URL of your dedicatedmonitoring cluster. Even if you are using a dedicated monitoring cluster, theLogstash metrics must be routed through your production cluster. You can specifya single host as a string, or specify multiple hosts as an array. Defaults tohttp://localhost:9200. -
xpack.monitoring.elasticsearch.usernameandxpack.monitoring.elasticsearch.password - If your Elasticsearch is protected with basic authentication, these settings provide theusername and password that the Logstash instance uses to authenticate forshipping monitoring data.
Monitoring Collection Settings
-
xpack.monitoring.collection.interval -
Controls how often data samples are collected and shipped on the Logstash side.Defaults to
10s. If you modify the collection interval, set thexpack.monitoring.min_interval_secondsoption inkibana.ymlto the same value.
X-Pack monitoring TLS/SSL Settings
You can configure the following Transport Layer Security (TLS) orSecure Sockets Layer (SSL) settings. For more information, seeConfiguring Credentials for Logstash Monitoring.
-
xpack.monitoring.elasticsearch.ssl.certificate_authority -
Optional setting that enables you to specify a path to the
.pemfile for thecertificate authority for your Elasticsearch instance. -
xpack.monitoring.elasticsearch.ssl.truststore.path - Optional settings that provide the paths to the Java keystore (JKS) to validatethe server’s certificate.
-
xpack.monitoring.elasticsearch.ssl.truststore.password - Optional settings that provide the password to the truststore.
-
xpack.monitoring.elasticsearch.ssl.keystore.path - Optional settings that provide the paths to the Java keystore (JKS) to validatethe client’s certificate.
-
xpack.monitoring.elasticsearch.ssl.keystore.password - Optional settings that provide the password to the keystore.